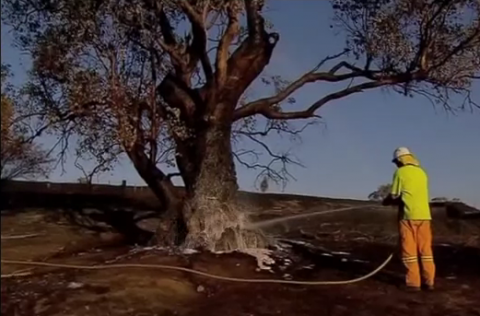
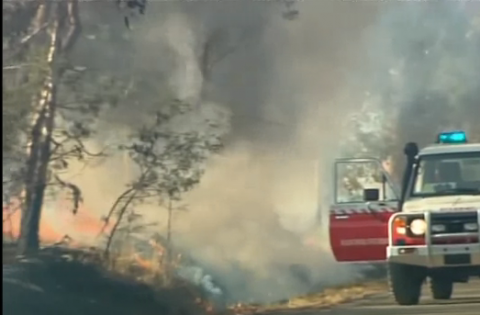
On Tuesday January 8 the Bureau of Meteorology released an interim special climate statement on the Extreme January heat Australia is currently experiencing (Updated on January 14). Record temperatures both day-time maximum and night-time minimums continue to be broken as of 13 January. The extraordinary heatwave has also been the scene for catastrophic fires, especially in Tasmania. The Prime Minister Julia Gillard saw the devastation in Dunalley and amoung her many interviews and press conferences made a brief statement connecting the intensity of bushfires with climate change.
The Extreme Heatwave had its origins in late December, but seriously started on January 3. It covers an extensive part of the continent mainly affecting inland areas but occasionally impacting the coast. Dr Braganza described it has "It's just an extensive dome of heat over the continent," in a Sydney Morning Herald report. Dr Karl Braganza is Manager of Climate Modelling at the Bureau of Meteorology.
The Bureau statement says the spatial extent of the heatwave is highly unusual resulting in many individual station temperatures and national average temperature records being broken, "To date (data up to the 6 January 2013) the national area-average for each of the first 6 days of 2013 has been in the top 20 hottest days on record, with 6 January the fifth hottest on record and the first time 5 consecutive days over 39 °C has ever been recorded for Australia." says the statement.
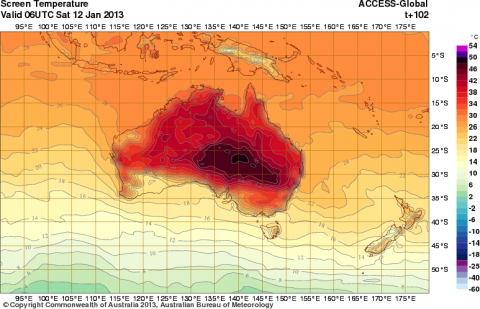
The colour purple: temperature scale upgraded to cope with heatwave
Latest news is that the Bureau of Meteorology have just added new colours at the top of the temperature scale: 50 to 54 degrees C. Welcome to the global warming future.
Wow! Bureau of Meteorology adds extra colours to temperature scale next week: 54°C! @aus_scienceweek #bigaussieheat twitter.com/Aus_ScienceWee…
— takver (@takvera) January 8, 2013
David Jones, head of the bureau's climate monitoring and prediction unit, explained "The scale has just been increased today and I would anticipate it is because the forecast coming from the bureau's model is showing temperatures in excess of 50 degrees," he told the Sydney Morning Herald.
However, this may be due to one of the modelling predictions according to Aaron Coutts-Smith, the bureau's NSW head of climate monitoring, "The indications are, from the South Australian office, that we are not looking at getting any where near that (50 degree level)."
Then again, according to Dr Jones the temperature of the air mass is still warming up. Uh Oh! "The air mass over the inland is still heating up - it hasn't peaked," Dr Jones told the Herald.
According to David Spratt's 2011 blog on a scientific study from the Royal Netherlands Meteorological Institute and Institute for Marine and Atmospheric Research at Utrecht University, Most of Australia can expect extreme temperatures of more than 50 degrees by end of century
If you think this is a one off event, then think again. Dr Markus Donat, a Postdoctoral Research Fellow at the Climate Change Research Centre, UNSW said that:
"In recent studies we have analysed how extreme temperatures have changed globally. For most regions, including Australia, we found that extremely high temperatures have become more frequent and more intense, while extremely low temperatures are occurring less frequently than they did in the middle of the 20th century."
"Counting the number of very warm days (in this specific case defined as the warmest 5% during the 1951-1980 period) we found that during the most recent 3 decades 1981-2010 the frequency of days in this warmest category has increased by 40% globally."

Human Physical limits on the temperature we can sustain
Humans have upper physical limits on the temperature we can sustain over long and short periods. When the temperature starts approaching our body temperature, about 38 degrees C, we have trouble regulating our bodies and heat stress results which can quickly lead to death. Don't believe me? Scientists outlined the health limits of heat stress with Climate Change in a 2010 scientific paper. Or read what Liz Hanna, Convenor, Climate Change Adaptation Research Network - Human Health at ANU has to say:
"Those of us who spend our days trawling - and contributing to - the scientific literature on climate change are becoming increasingly gloomy about the future of human civilisation. We are well past the time of niceties, of avoiding the dire nature of what is unfolding, and politely trying not to scare the public. The unparalleled setting of new heat extremes is forcing the continual upwards trending of warming predictions for the future, and the timescale is contracting. This trepidation on the part of scientist and researchers, and in some cases flagrant resistance by stakeholders in the fossil fuel industry, to allow the real story to be fully revealed and comprehended by the public at large, has allowed the stalling of action to save the planet, and ourselves.
"To speak of heat alone, heat already kills more Australians than the road toll. If it is not already double, it soon will be. From a health perspective, there is an upper limit to human tolerance of heat. We begin to feel ill when our body temperature reaches 38 degrees. Our metabolism and moving muscles generate heat which must be shed to the environment. This starts to become difficult when the air temperature exceeds 30 degrees, and is severely hampered as it reaches 35 or more. Most people cannot sustain physical exercise beyond a few minutes in very high temperatures without experiencing heat gain. It places great strain on the heart, and hence the elderly and heart conditions are particularly vulnerable.
"The temperature at which we succumb will vary according to the humidity; our familiarisation with hot conditions; our general capacity to thermoregulate (maintain our normal body temperature); our level of exposure to the heat, plus our level of heat generation via exercise. Physical exercise generates heat, and so our body tells us to slow down and rest. We feel lethargic. This is a survival mechanism, and should not be disregarded. Workplace and family duties that compel us to keep moving exacerbate our risk of overheating. We should not underestimate the seriousness of heat stress. Overheating can and does kill, even the young and fit. However, the most vulnerable to heat include the elderly, those with heart conditions, and the very young. People who cannot access cooled environments are also at risk. The response of turning on air conditioners only exacerbates the problem of global warming. The only correct response is to slow down, and ultimately reverse, the warming."
So maybe it's time we put some pressure on State and Federal Governments to ramp up action on carbon emissions. We should be encouraging corporate responsibility as well, in sharp contrast to the unethical financial investment actions of companies such as Origin Energy and the ANZ Bank for choosing to fund high carbon intensive and polluting activities.
Here is the text of the BoM statement in full:
Introduction
Large parts of central and southern Australia are currently under the influence of a persistent and widespread heatwave event. This event is ongoing with further significant records likely to be set. Further updates of this statement and associated significant observations will be made as they occur, and a full and comprehensive report on this significant climatic event will be made when the current event ends.
The last four months of 2012 were abnormally hot across Australia, and particularly so for maximum (day-time) temperatures. For September to December (i.e. the last four months of 2012) the average Australian maximum temperature was the highest on record with a national anomaly of +1.61 °C, slightly ahead of the previous record of 1.60 °C set in 2002 (national records go back to 1910). In this context the current heatwave event extends a four month spell of record hot conditions affecting Australia. These hot conditions have been exacerbated by very dry conditions affecting much of Australia since mid 2012 and a delayed start to a weak Australian monsoon.
The start of the current heatwave event traces back to late December 2012, and all states and territories have seen unusually hot temperatures with many site records approached or exceeded across southern and central Australia. A full list of records broken at stations with long records (>30 years) is given below.
The current heatwave event commenced with a build up of extreme heat in the southwest of Western Australia from 25-30 December 2012 as a high in the Bight and a trough near the west coast directed hot easterly winds over the area. Particularly hot conditions were observed on the 30th, with Cape Naturaliste observing 37.7 °C, its hottest December day in 56 years of record.
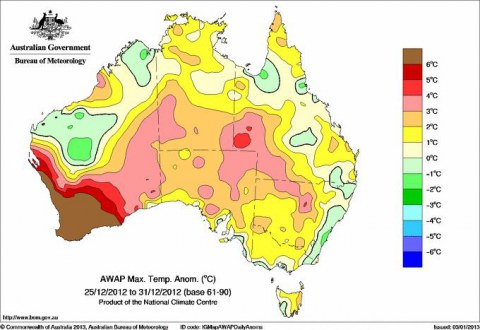
Figure 1: The maximum temperature anomaly from the 1961-1990 average
for the last week of December (the start of the heatwave event in Western
Australia). Units are °C.From 31 December the high pressure system began to shift eastward, bringing well above average temperatures across southern WA between the 30 December and 2 January. Temperatures reached 47.7 °C at Eyre on the 2nd its hottest day in 24 years of record, while Eucla recorded 48.2 °C on the 3rd, its hottest day since records began in 1957.
By the 4 January the high pressure system had moved off eastern Australia, with northerly winds directing very hot air into southeast Australia, while southerly winds eased temperatures in WA. Hobart experienced a minimum temperature of 23.4 °C on the 4th (its hottest January night on record), followed by a maximum of 41.8 °C (its hottest maximum temperature on record for any month in 130 years of records) and the highest temperature observed anywhere in southern Tasmania.
The area of intense heat moved northeast on the 5th as the high pressure system, now centred over the Tasman Sea, and a low pressure trough directed hot northerly winds into the Riverina and western NSW. Areas affected recorded temperatures well in excess of 40 °C, with Marree in SA recording 48.4 °C, Yarrawonga in VIC recording 45.7 °C and Hay in NSW recording 47.7 °C, breaking its annual daytime temperature record.
Western Australia saw a second wave of recording breaking heat on 8-10 January as a second high pressure system moved into the Great Australian Bight directing hot easterly winds in to the state. The highest temperature recorded in WA during this event was 49.0 °C at Leonora, breaking Leonora's previous record of 48.3 °C, set the day before, with temperatures above 45 °C widespread in interior Western Australia.
Following two days of cooler conditions in the southeast of Australia intense heat returned on the 11th of January. This second wave of heat reached its peak on the 12th and 13th in the eastern states, with Moomba Airport in SA recording 49.6 °C on the 12th (the highest of the event thus far and the highest temperature in SA outside of January 1960), 48.6 °C at Wanaaring Post Office in NSW on the 12th and 49.0 °C at Birdsville in QLD on the 13th. On the morning of the 14th Bedouri Police Station in QLD recorded an overnight minimum temperature of 34.1 °C the highest of the event thus far and the hottest in Queensland since 34.4 °C on 5 January 2006.
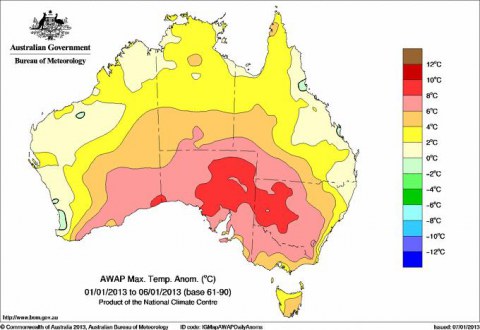
Figure 2: The maximum temperature anomaly from the1961-1990 average for January 1 to 6. Units are °C.
Record-breaking daily temperatures
Tables 1 to 2 below give a list of all significant daily maximum and minimum temperature records broken during the course of this heatwave event to date. Many stations have also approached but not exceeded historical records including Adelaide (45.0 °C, its fourth warmest day on record). Many stations with shorter periods of observation (i.e., less than 30 years) have also broken records.
A particular feature of this heatwave event has been the exceptional spatial extent of high temperatures. Table 3 gives the national and state/territory average maximum temperature for each day of the heatwave event. Australia set a new record for the highest national area-average temperature, recording 40.33 °C and surpassing the previous record set on 21 December 1972 (40.17 °C). To date (data up to the 8 January 2013) the national area-average for each of the first 8 days of 2013 have been in the top 20 hottest days on record, with 8 January the third hottest on record and the first time 7 consecutive days over 39 °C has ever been recorded for Australia.
On Monday Australia recorded a new area-averaged mean temperature (average of the maximum and minimum) record of 32.23 °C, surpassing the old record of 31.86 °C set n 21 December 1972. This new record was subsequently broken on 8 January (32.36 °C), making 7-8 January 2013 Australia’s hottest 2-day period on record.


Weather records and extreme temperatures recorded up to 6th January 2013
Tables from the Special Climate Statement 43 - Extreme January heat - Last update 14 January, 2013 by Climate Information Services, Bureau of Meteorology.
| Table 1: New daily maximum temperature records set during the event (stations with 30 or more years of historical records). |
||||||
|---|---|---|---|---|---|---|
| Station number | Location State | Temperature (°C) | Date | Previous Record | Date | Years of record |
| 9519 | Cape Naturaliste WA | 37.7 | 30-Dec | 37.6 | 26/12/2007 | 56 |
| 9842 | Jarrahwood WA | 40.5 | 30-Dec | 40.5 | 26/12/2007 | 38 |
| 11003 | Eucla WA | 48.2 | 3-Jan | 47.9 | 3/01/1979 | 53 |
| 94029 | Hobart TAS | 41.8 | 4-Jan | 40.8 | 4/01/1976 | 120 |
| 94008 | Hobart Airport TAS | 40.3 | 4-Jan | 40.1 | 3/01/1991 | 55 |
| 95003 | Bushy Park TAS | 40.3 | 4-Jan | 39.5 | 20/01/1973 | 53 |
| 92027 | Orford TAS | 38.8 | 4-Jan | 38.7 | 21/01/1997 | 45 |
| 92045 | Larapuna TAS | 36.5 | 4-Jan | 36.1 | 16/01/1960 | 56 |
| 97053 | Strathgordon Village TAS | 34.8 | 4-Jan | 34.5 | 4/01/1976 | 32 |
| 91223 | Marrawah TAS | 33.2 | 4-Jan | 33 | 29/01/2009 | 42 |
| 94087 | Mount Wellington TAS | 29.5 | 4-Jan | 29.2 | 22/01/2006 | 34 |
| 90171 | Portland VIC | 42.1 | 4-Jan | 41.6 | 26/01/2006 | 31 |
| 23034 | Adelaide Airport SA | 44.1 | 4-Jan | 44 | 28/01/2009 | 58 |
| 18040 | Kimba SA | 45 | 4-Jan | 45.6 | 31/01/1968 | 46 |
| 15511 | Curtin Springs SA | 45.6 | 4-Jan | 45.5 | 28/01/2011 | 49 |
| 17110 | Leigh Creek Airport SA | 46.2 | 5-Jan | 46.1 | 25/01/2011 | 31 |
| 75031 | Hay NSW | 47.7 | 5-Jan | 46 | 23/01/2001 | 56 |
| 72043 | Tumbarumba NSW | 40 | 5-Jan | 39.8 | 30/01/2009 | 46 |
| 17110 | Leigh Creek Airport SA | 46.3 | 6-Jan | 46.2 | 5/01/2013 | 31 |
| 72043 | Tumbarumba NSW | 40 | 6-Jan | 39.8 | 30/01/2009 | 46 |
| 12046 | Leonora WA | 47.8 | 7-Jan | 47.8 | 1/01/1957 | 57 |
| 15511 | Curtin Springs NT | 45.7 | 8-Jan | 45.6 | 4/01/2013 | 49 |
| 15603 | Kulgera NT | 44.9 | 8-Jan | 44.9 | 28/01/2011 | 33 |
| 12046 | Leonora WA | 48.3 | 8-Jan | 47.8 | 17/01/1958 | 57 |
| 12090 | Yeelirrie WA | 47.9 | 8-Jan | 45.8 | 07/01/1983 | 40 |
| 7139 | Paynes Find WA | 47.2 | 8-Jan | 46.5 | 20/01/1991 | 34 |
| 7045 | Meekatharra Airport WA | 47.1 | 8-Jan | 45.7 | 05/01/2008 | 63 |
| 13017 | Giles MO WA | 45.6 | 8-Jan | 44.8 | 28/01/2011 | 57 |
| 13012 | Wiluna WA | 47.6 | 8-Jan | 46.9 | 01/01/1990 | 56 |
| 12046 | Leonora WA | 49 | 9-Jan | 48.3 | 08/01/2013 | 57 |
| 46037 | Tibooburra Post Office NSW | 47.9 | 12-Jan | 47.6 | 03/01/1973 | 103 |
| 51039 | Nyngan Airport NSW | 47 | 12-Jan | 46.9 | 15/01/1939 | 55 |
| 52020 | Mungindi Post Office NSW | 46.8 | 12-Jan | 46.5 | 04/01/1990 | 48 |
| 51049 | Trangie Research Station NSW | 46.1 | 12-Jan | 45 | 15/01/2001 | 45 |
| 50031 | Peak Hill Post Office NSW | 44.5 | 12-Jan | 44.3 | 03/01/1973 | 46 |
| 61250 | Paterson NSW | 43.8 | 12-Jan | 43.7 | 15/01/2001 | 43 |
| 64009 | Dunedoo Post office NSW | 43.7 | 12-Jan | 43.4 | 03/01/1973 | 49 |
| 65034 | Wellington NSW | 43.7 | 12-Jan | 42.5 | 03/01/1990 | 46 |
| 55024 | Gunnedah Resource Centre NSW | 42.3 | 12-Jan | 42.3 | 07/01/1964 | 65 |
| 62013 | Gulgong Post Office NSW | 42 | 12-Jan | 41.5 | 15/01/2001 | 43 |
| 61051 | Murrurundi Post Office NSW | 40.9 | 12-Jan | 40.2 | 27/01/1981 | 49 |
| 63005 | Bathurst Ag Station NSW | 40.2 | 12-Jan | 39 | 12/01/2007 | 47 |
| 63254 | Orange Ag Institute NSW | 37.2 | 12-Jan | 36.7 | 15/01/2001 | 38 |
| 55136 | Woolbrook NSW | 36.5 | 12-Jan | 36.5 | 08/01/1994 | 40 |
| 63039 | Katoomba NSW | 36.4 | 12-Jan | 36.2 | 14/01/2005 | 51 |
| 38024 | Windorah Post Office QLD | 47.6 | 12-Jan | 47 | 04/01/1973 | 47 |
| 44026 | Cunnamulla Post Office QLD | 46.9 | 12-Jan | 46.9 | 04/01/1973 | 54 |
| 45015 | Quilpie Airport QLD | 46.5 | 12-Jan | 46.5 | 04/01/1973 | 56 |
| 15511 | Curtin Springs NT | 45.9 | 12-Jan | 45.5 | 28/01/2011 | 49 |
| 64009 | Dunedoo Post Office NSW | 43.4 | 13-Jan | 43.4 | 03/01/1973 | 49 |
| 55024 | Gunnedah Resource Centre NSW | 42.3 | 13-Jan | 42.3 | 07/01/1964 | 65 |
| 44026 | Cunnamulla Post Office QLD | 47 | 13-Jan | 46.9 | 04/01/1973 | 54 |
Highlighted records (in yellow) indicate the monthly record is also an annual record.
| Table 2: New daily minimum temperature records set during the event (stations with 30 or more years of historical records). |
||||||
|---|---|---|---|---|---|---|
| Station number | Location State | Temperature (°C) | Date | Previous Record | Date | Years of record |
| 9021 | Perth Airport WA | 27.5 | 29-Dec | 26.9 | 24/12/1960 | 69 |
| 9111 | Karnet WA | 23.5 | 29-Dec | 22.6 | 29/12/2009 | 47 |
| 9519 | Cape Naturaliste WA | 24.3 | 30-Dec | 24.3 | 26/12/2007 | 56 |
| 9518 | Cape Leeuwin WA | 23.8 | 1-Jan | 23.5 | 26/01/2012 | 107 |
| 94029 | Hobart TAS | 23.4 | 4-Jan | 22.9 | 10/01/1887 | 120 |
| 94008 | Hobart Airport TAS | 21.8 | 4-Jan | 21.2 | 3/01/2012 | 55 |
| 94010 | Cape Bruny Lighthouse TAS | 20.4 | 4-Jan | 20 | 16/01/1960 | 57 |
| 71032 | Thredbo AWS NSW | 17.1 | 5-Jan | 17 | 26/01/2003 | 33 |
| 84070 | Point Hicks VIC | 25 | 5-Jan | 23.8 | 3/01/2012 | 47 |
| 75031 | Hay (Miller St) NSW | 31 | 8-Jan | 31 | 24/01/2001 | 56 |
| 75041 | Griffith Airport NSW | 30 | 8-Jan | 30 | 30/01/2006 | 37 |
| 71041 | Thredbo Village NSW | 21 | 8-Jan | 19.2 | 08/01/1079 | 42 |
| 10092 | Merridin WA | 29.7 | 8-Jan | 29.3 | 26/01/2011 | 48 |
| 9842 | Jarrahwood WA | 26 | 8-Jan | 24.3 | 12/01/1978 | 33 |
| 9518 | Cape Leeuwin WA | 24.2 | 8-Jan | 23.5 | 26/01/2012 | 107 |
| 9741 | Albany Airport WA | 20.4 | 8-Jan | 20 | 26/01/1974 | 48 |
| 45015 | Quilpie Airport QLD | 32.5 | 13-Jan | 32.1 | 30/01/2003 | 57 |
| 15511 | Curtin Springs NT | 31.5 | 13-Jan | 31.4 | 04/01/2006 | 49 |
*Highlighted records (in yellow) indicate the monthly record is also an annual record.
Please download the original statement - Observed records for January heat event (PDF) for Tables 3, 4, and 5.
Sources
- Special Climate Statement 43 - Observed records for January heat event (PDF) - Last update 14 January, 2013 by Climate Information Services, Bureau of Meteorology.
- Australian Science Media Centre, 8 January 2013 - Heatwave - experts respond
- Sydney Morning Herald, 8 January 2013 - Temperatures off the charts as Australia turns deep purple